OPEN-SOURCE • GENOME VISUALISATION • BACTOPAINTER
Painting with bacterial genomes
A bacterial genome is usually read as code. BactoPainter asks what happens when every gene is allowed to become a colour.
Built by Adrien Assié
Bioinformatics meets generative art.
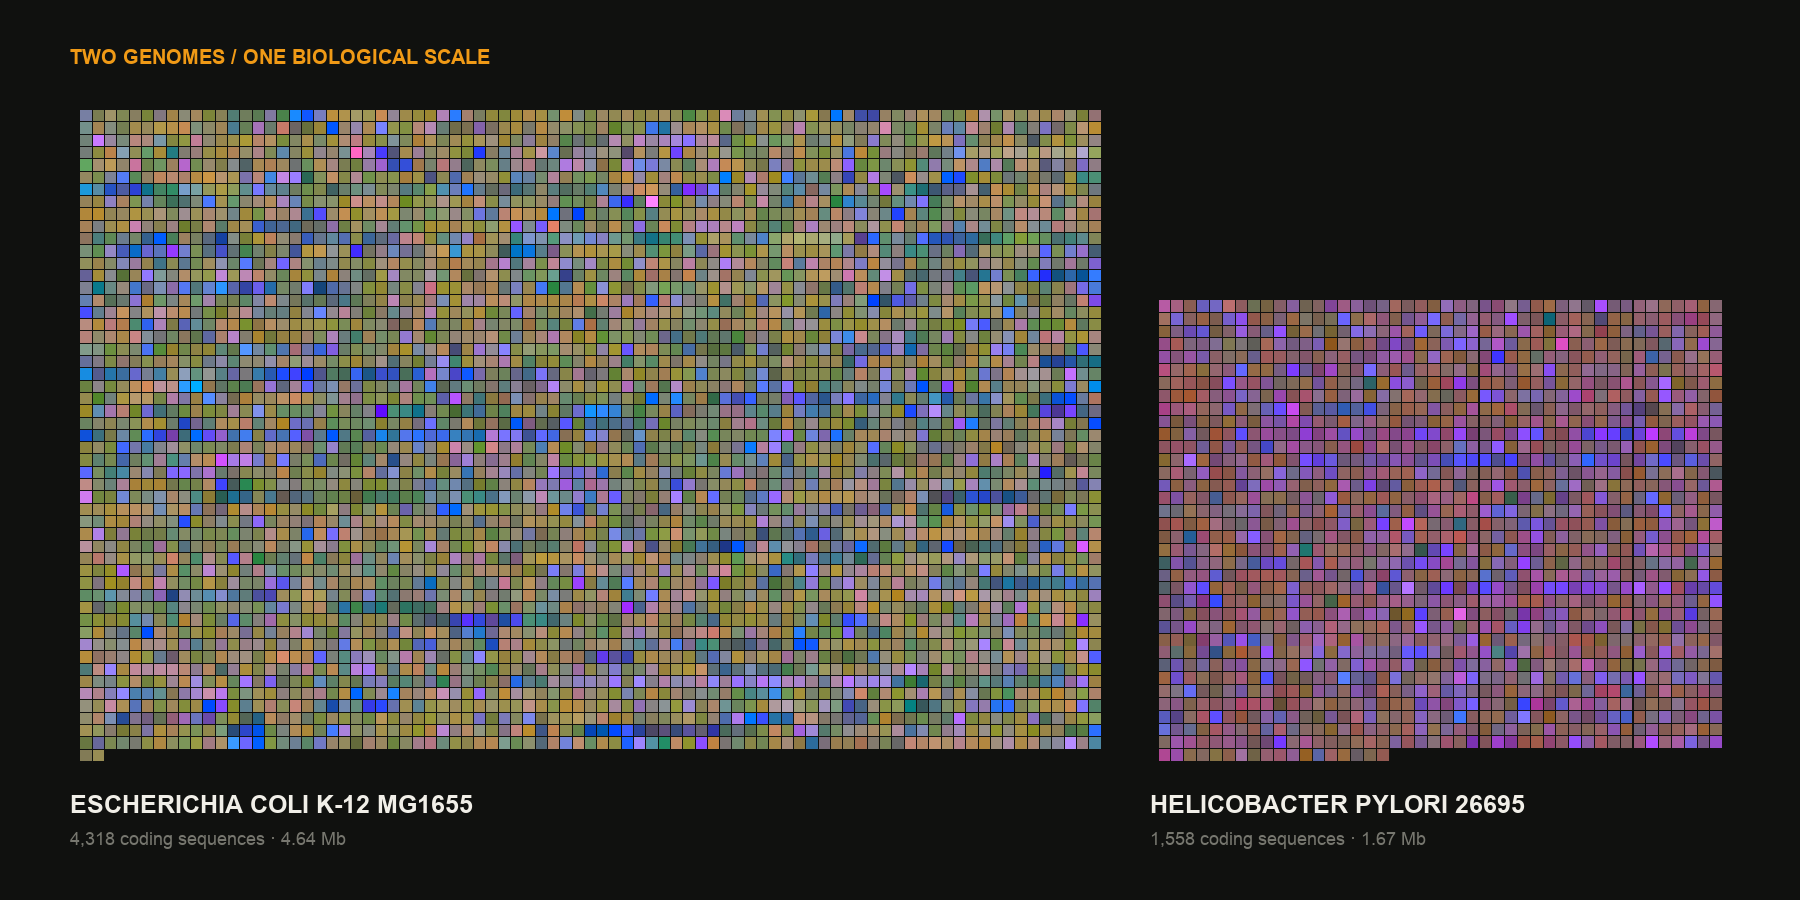
E. coli K-12 MG1655 and H. pylori 26695 rendered on the same absolute biological colour scale. Every tile is one annotated coding sequence.
01 — THE IDEA
A genome is also a palette
Genomes are full of pattern, but most of that pattern remains trapped in sequences and tables. BactoPainter gives three biological measurements a visual grammar—then lets the chromosome compose the image.
The result sits between genomic overview, exploratory instrument, and generative art. It is not decoration placed over the data. The data determines the image.
02 — THREE SIGNALS, ONE COLOUR
RED
Codon Adaptation Index
Brighter red indicates codon usage better adapted to the genome—a possible signal of highly expressed genes.
GREEN
GC content
The proportion of guanine and cytosine carries a strong taxonomic and compositional signature.
BLUE
Karlin distance
An atypical dinucleotide signature can flag genes worth investigating for horizontal transfer.
03 — SAME GENOME. NEW PERSPECTIVES.
Three H. pylori strains, one visual language
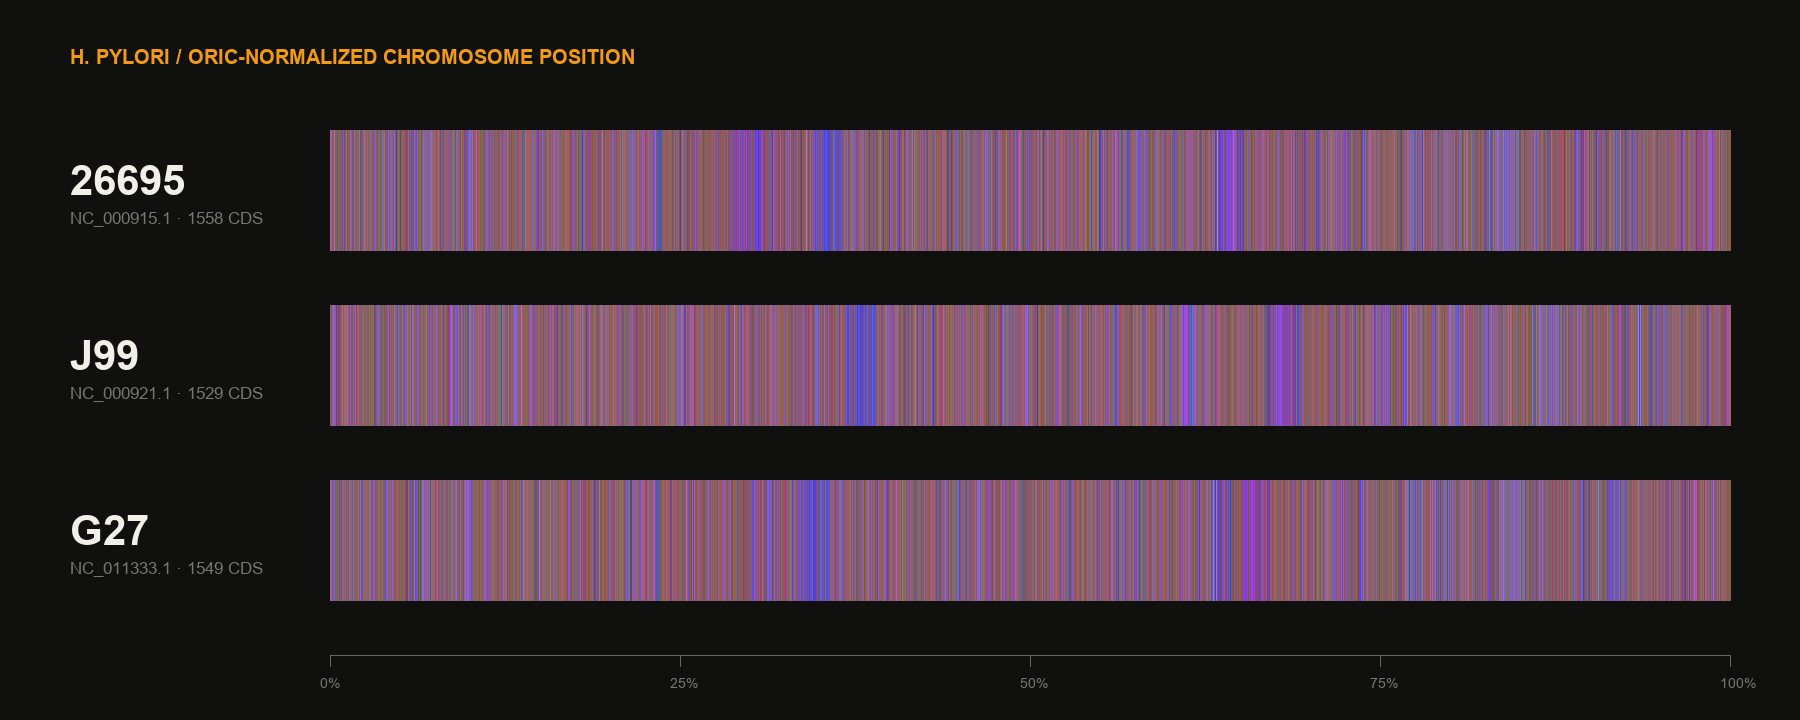
I processed strains 26695, J99, and G27 with the same absolute colour scales. Their chromosomes are close in size and overall composition, but their local colour rhythms differ.
Shared fields reflect the species’ broadly similar composition. Brighter interruptions reveal local changes in GC content, codon adaptation, or dinucleotide signature.
Important: positions are normalized, not homolog-aligned. A matching band is a hypothesis to investigate—not proof of the same gene.
04 — THE WORKFLOW
From sequence file to colour field
01
Read an annotated GenBank file, or FASTA with GFF annotation.
02
Locate OriC from annotation or cumulative GC skew.
03
Calculate CAI, GC content, and Karlin distance for every CDS.
04
Export biological values and RGB channels; render grid, barcode, spiral, or circle.
A picture that leads back to the sequence
A good scientific image does not end the analysis. It makes the next question difficult to ignore.
